Using RMarkdown
Last updated on 2024-03-12 | Edit this page
Overview
Questions
- What is sentment analysis?
- How can text analysis evaluate emotion?
Objectives
- Analyze sentiment using general-purpose lexicons
- Visualize the sentiment analysis results using column chart and word cloud
Introduction
This is a lesson created via The Carpentries Workbench. It is written in Pandoc-flavored Markdown for static files and R Markdown for dynamic files that can render code into output. Please refer to the Introduction to The Carpentries Workbench for full documentation.
What you need to know is that there are three sections required for a valid Carpentries lesson template:
-
questionsare displayed at the beginning of the episode to prime the learner for the content. -
objectivesare the learning objectives for an episode displayed with the questions. -
keypointsare displayed at the end of the episode to reinforce the objectives.
OUTPUT
[1] "This new lesson looks good"You can add a line with at least three colons and a solution tag.
Figures
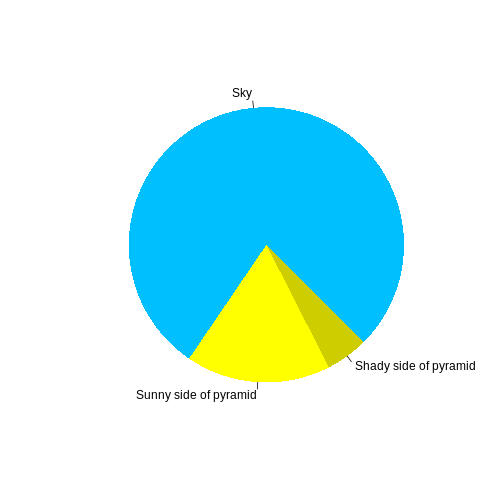
You can also include figures generated from R Markdown:
R
pie(
  c(Sky = 78, "Sunny side of pyramid" = 17, "Shady side of pyramid" = 5),
  init.angle = 315,
  col = c("deepskyblue", "yellow", "yellow3"),
  border = FALSE
)

Or you can use standard markdown for static figures with the following syntax:
{alt='alt text for accessibility purposes'}
Math
One of our episodes contains \(\LaTeX\) equations when describing how to create dynamic reports with {knitr}, so we now use mathjax to describe this:
$\alpha = \dfrac{1}{(1 - \beta)^2}$ becomes: \(\alpha = \dfrac{1}{(1 - \beta)^2}\)
Cool, right?
