Introduction to Text Mining
Figure 1
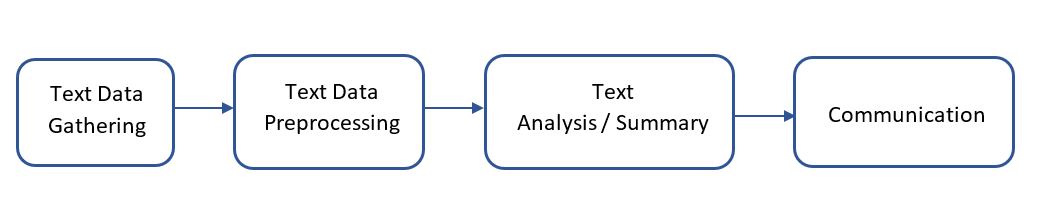
Figure 2
The output is a column chart: 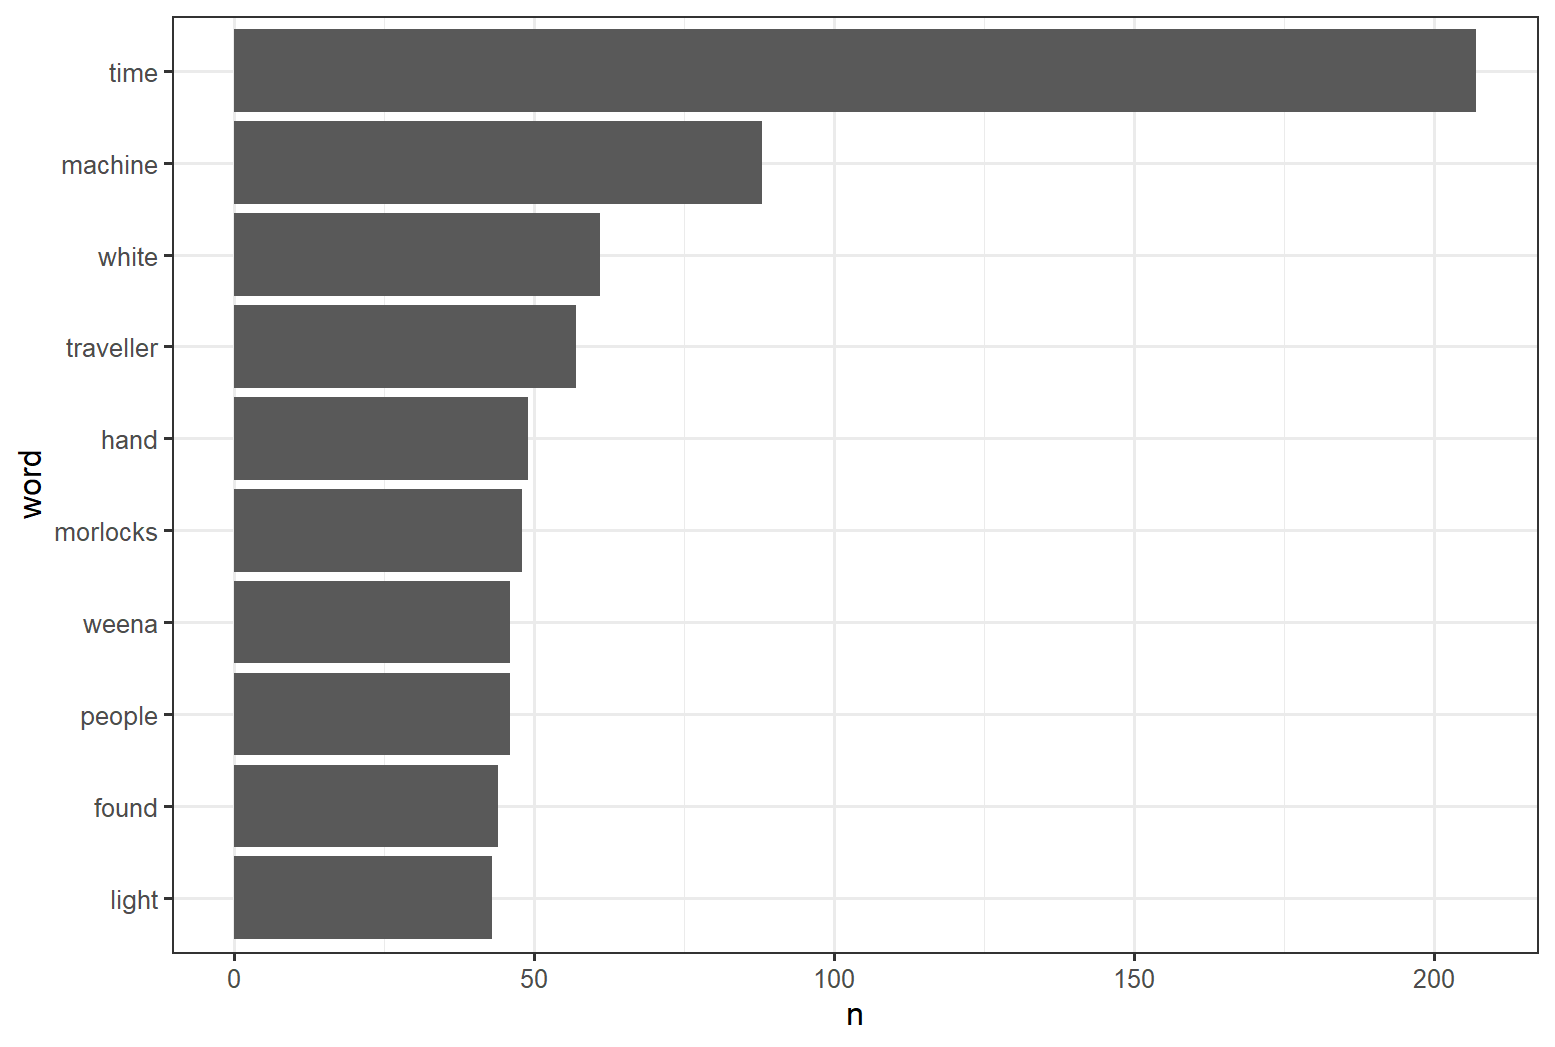
Figure 3
The output is a word cloud: 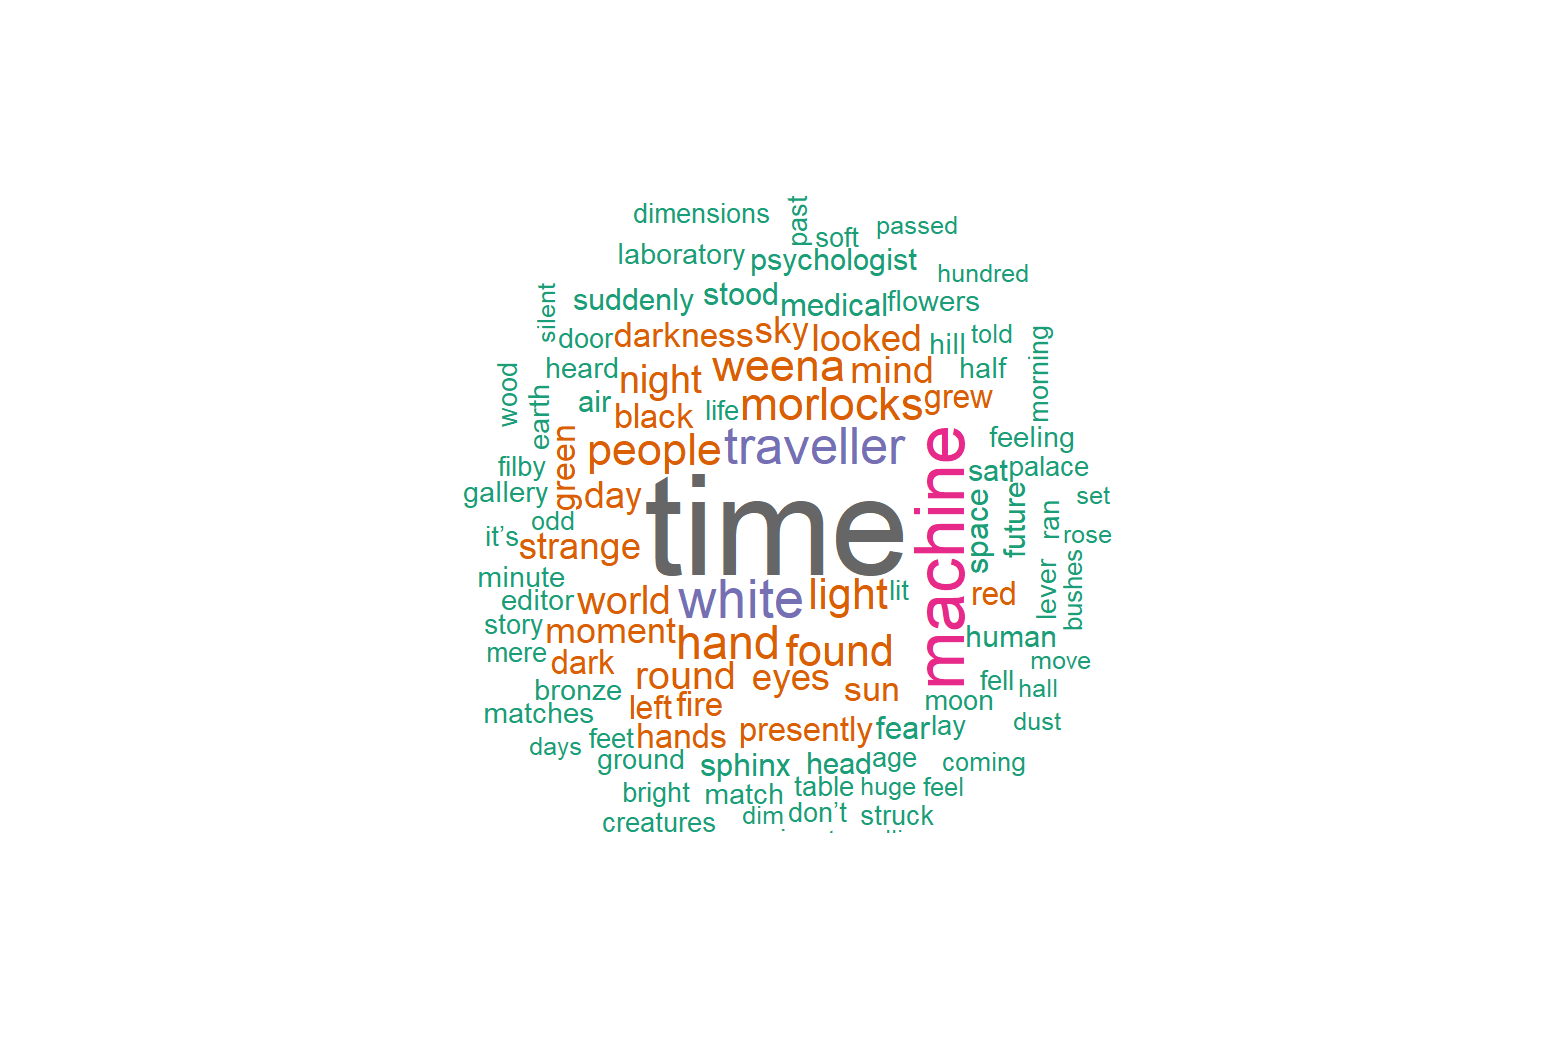
Sentiment Analysis
Figure 1
The output is a column chart: 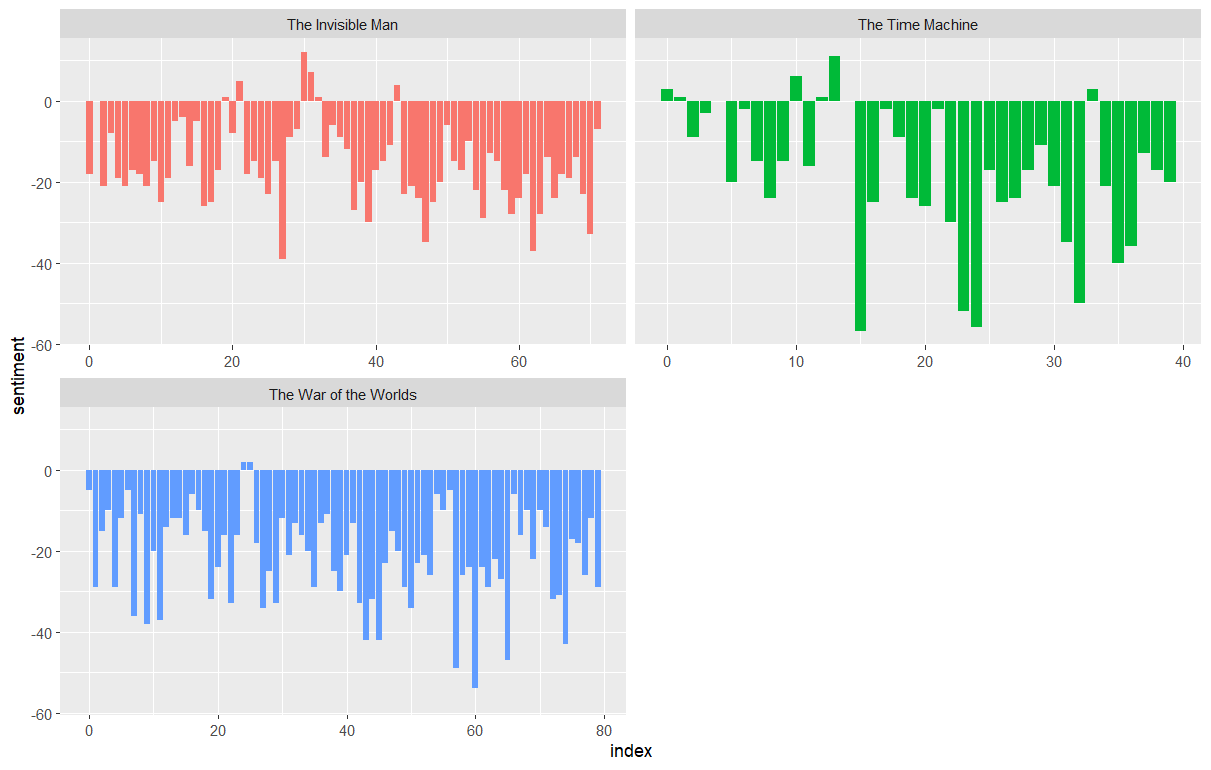
Figure 2
The output is a column chart: 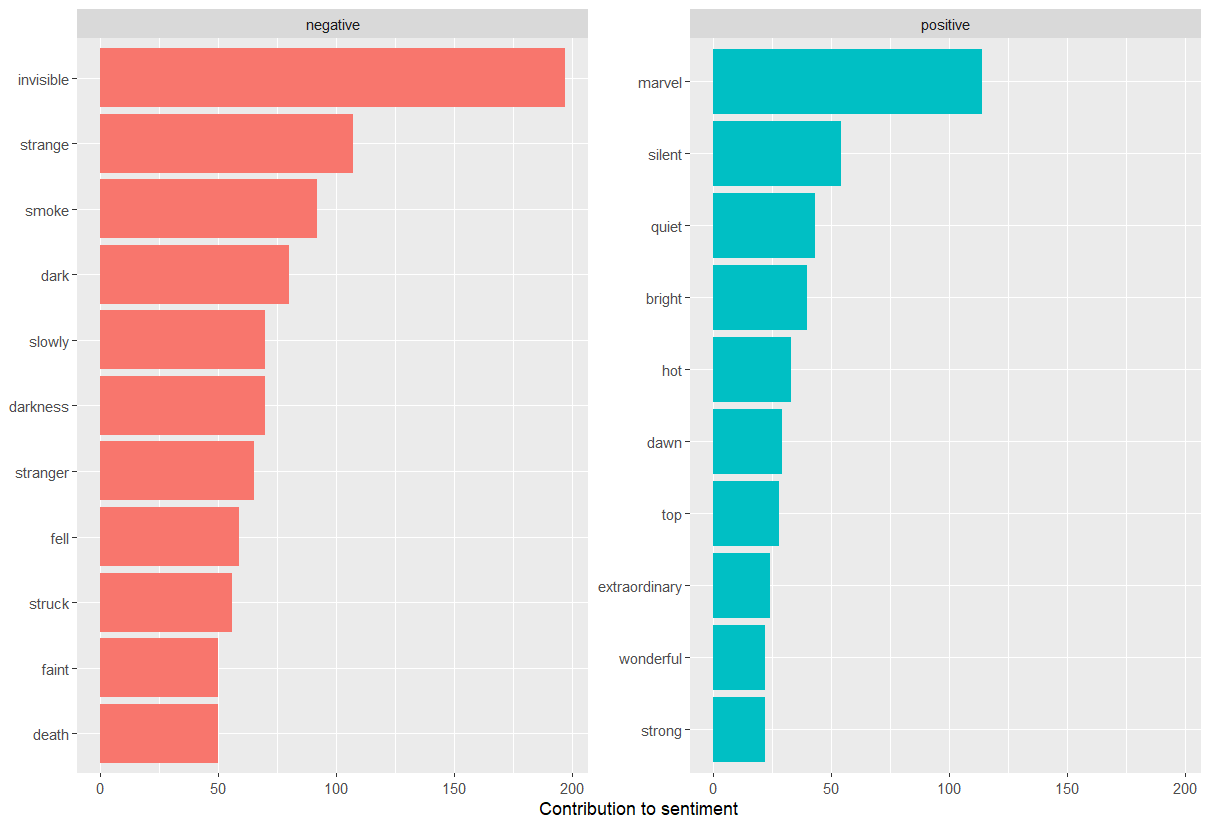
Using RMarkdown
Figure 1
The output is a column chart:
The output is a word cloud:
The output is a column chart:
The output is a column chart: